


Reporting
Management reports that build themselves
Adaptiv AI connects the places your numbers already live, from WhatsApp groups and Excel sheets to your accounting software and ERP, into one set of live dashboards. Sales, stock, production, debtors and cash are reconciled as they happen, so month-end becomes a review instead of a rebuild.

Where the hours go today
Production, sales and stock figures are posted in WhatsApp groups and collected by hand.
Someone spends days copying them into Excel and PowerPoint for the monthly meeting.
Payments are matched to invoices by hand, and the numbers rarely agree the first time.
The owner phones people to find out how the business did yesterday.
What we hear from operators
“Whatever production they meet so they will send to the platform... she collected and put it in... form of Excel and display[ed] it on the PowerPoint during the... monthly performance.”
“My boss may just call me in the evening and ask me [to] share with [him] the [debtors] list... [when] I am not with my laptop... I cannot be having figures in my head.”
Quoted word for word from conversations with operators. Names and companies are withheld.
How we fix it
- 01
Find the numbers
We list every report management uses, where each figure comes from and who prepares it.
- 02
Capture once
Each figure is captured where it is created, by the person or system that creates it.
- 03
Reconcile continuously
Sales, stock and bank movements are matched every day, and mismatches are flagged to the right person.
- 04
Show it live
A dashboard for the owner and each manager, on phone and laptop, with a weekly summary sent automatically.
What changes

The monthly performance pack is ready without a week of copying.
Debtors, creditors and cash available on a phone, any time.
Mismatches found the day they happen, not at month-end.
Every number traceable to its source.
Questions
What people ask us
What does a management dashboard show?
Whatever you run the business on. Typically sales by product, rep and customer, stock by location, production against plan, debtors, creditors and cash. We agree the list with you before we build.
Can it read from Sage, QuickBooks or Microsoft Dynamics?
Yes. We connect to the accounting system you already use and read the figures from it, rather than asking your team to type them again.
Is AI used to write the reports?
Where it helps. AI can summarise the week, explain why a number moved and flag what needs attention, but every figure comes from your records, not from the model.
How do we start, and what does it cost?
Book a free discovery call. We find the workflow that costs you most, then a free scoping session gives you a written scope and price band within 48 hours. Prices depend on what is built, so we never quote before we have seen how the work runs.
Industries we work in
 FMCG and food manufacturingAdaptiv AI helps FMCG and food manufacturers in Nigeria connect production, stock, orders, distribution and finance into one system.
 DistributionAdaptiv AI helps distribution businesses in Nigeria run orders, stock, vans, sales reps and collections from one connected system instead of WhatsApp groups and spreadsheets.
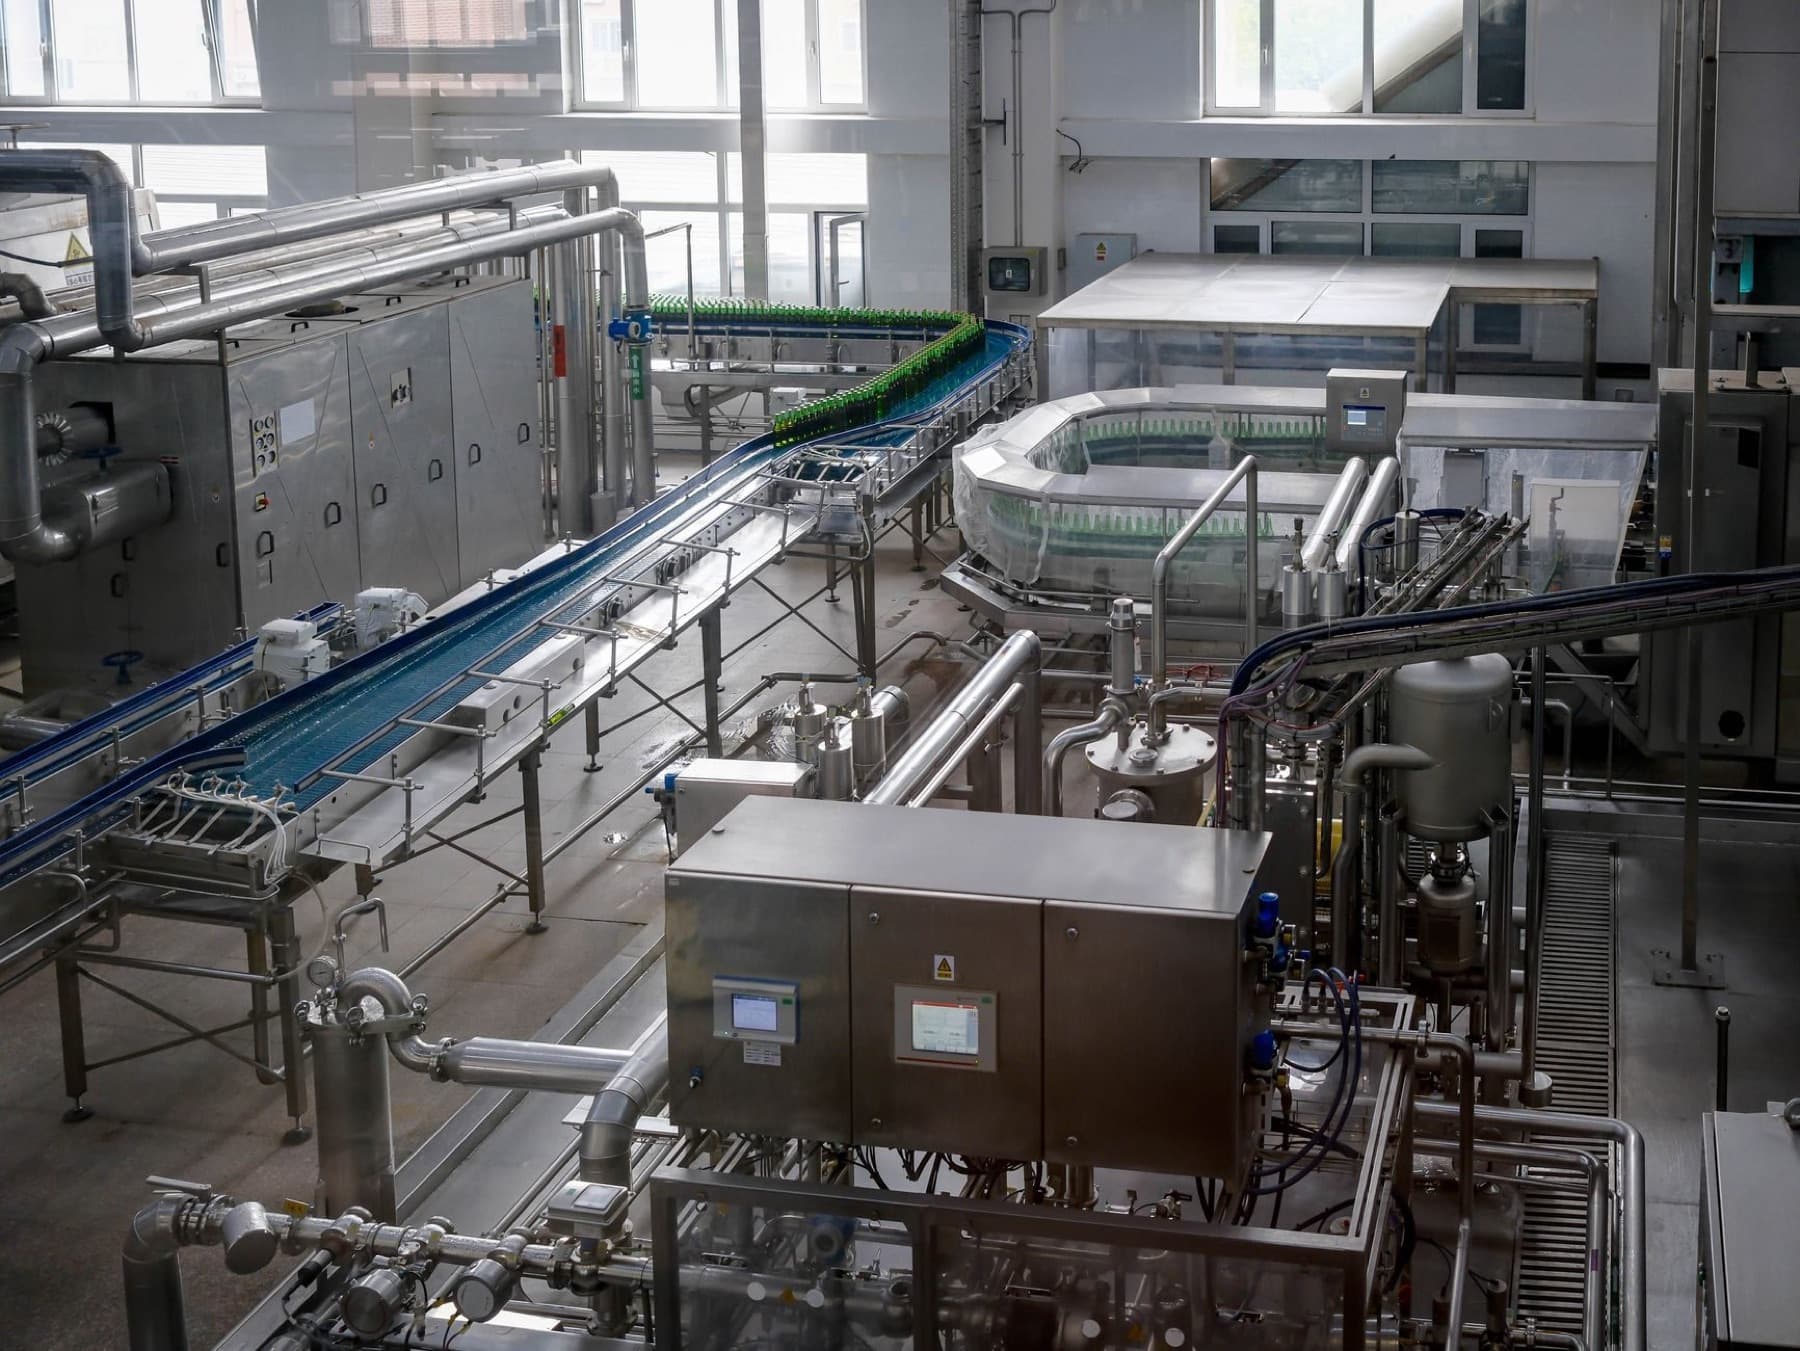 ManufacturingAdaptiv AI helps manufacturers in Nigeria replace paper production logs, spreadsheet stock and manual reports with one connected system covering raw materials, production, finished goods, dispatch and finance.
 Logistics and haulageAdaptiv AI helps logistics and haulage businesses in Nigeria connect bookings, dispatch, trips, drivers, fuel, proof of delivery and invoicing in one system.
Start with the workflow that costs you most.
A free discovery call, then a written scope and price band within 48 hours of the scoping session.